Point of Sale Solution Back Office Customer Analytics
Description
What's in this article?
Customer Analytics reports helps you monitor business performance based on customer activity, such as frequent visits, purchasing behavior, and top spenders. Understanding customer data provides valuable insights into business trends and supports more informed decision-making.
Frequent Visits
The Frequent Visits report shows customer activity within a selected time frame. By choosing a date range and defining minimum and maximum visit counts, the report identifies customers who meet your criteria. This insight can help you recognize loyal customers and create targeted marketing campaigns with personalized offers.
- In the Point of Sale Solution Back Office, select Customers > Analytics > Frequent Visits.
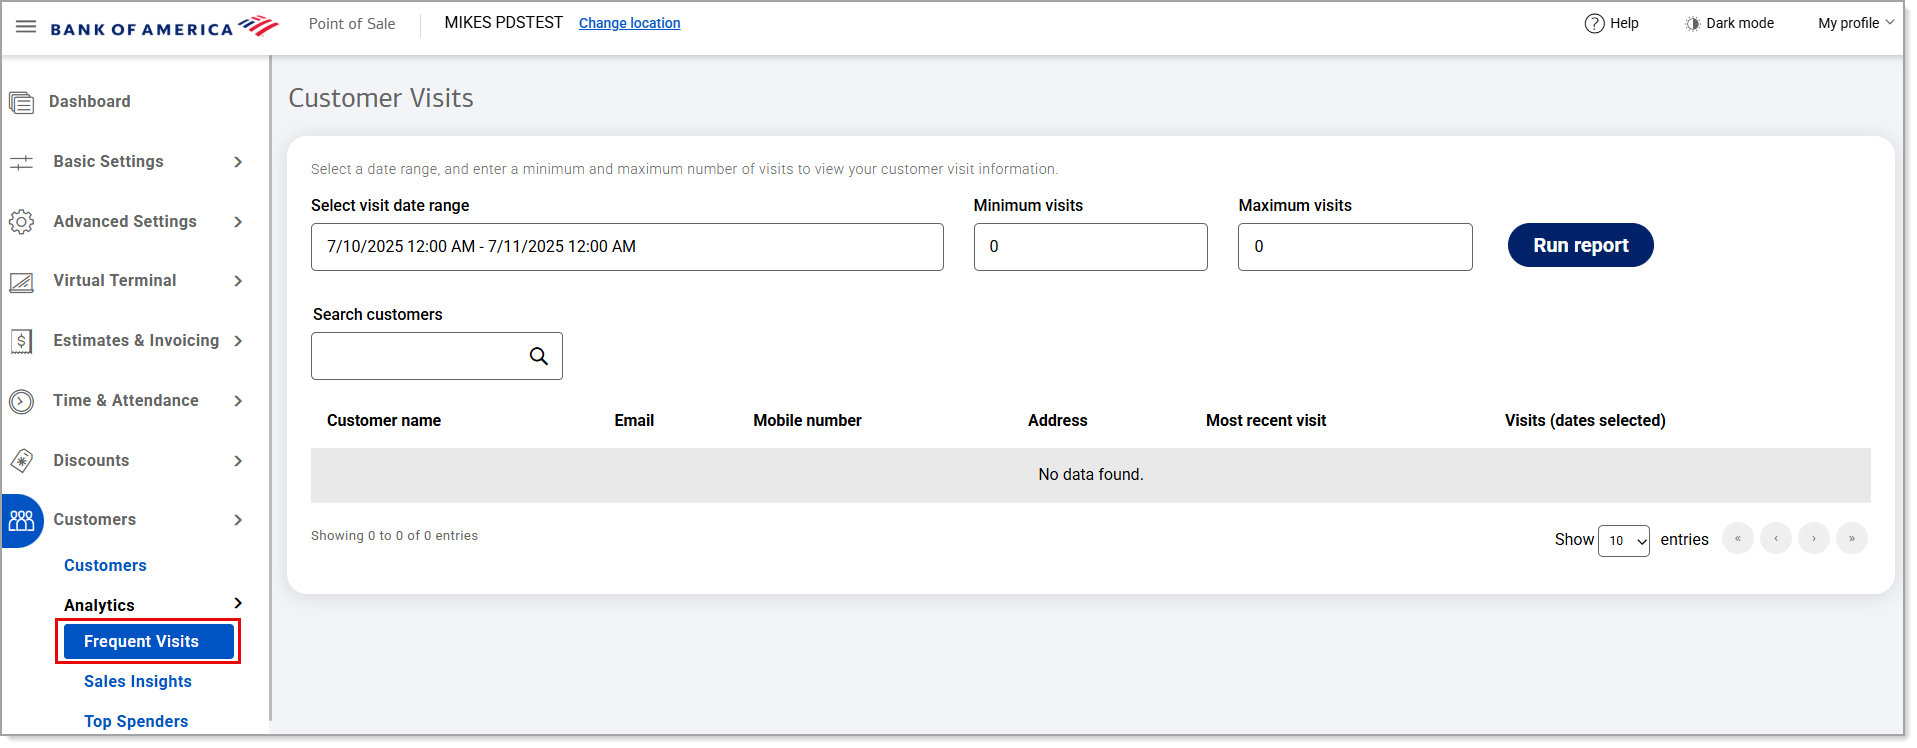
- Select a preset date range or click Custom Range to choose a custom one. Click Apply.
- Enter the minimum and maximum number of visits to include in the report.
- Click Run report.
Sales Insights
Sales Insights report identifies customers who have purchased specific products during a defined time period. For example, you can run a report to see customers who purchased eggs, bread, and milk—either any of those items or all of them.
- In the Point of Sale Solution Back Office, select Customers > Analytics > Sales Insights.
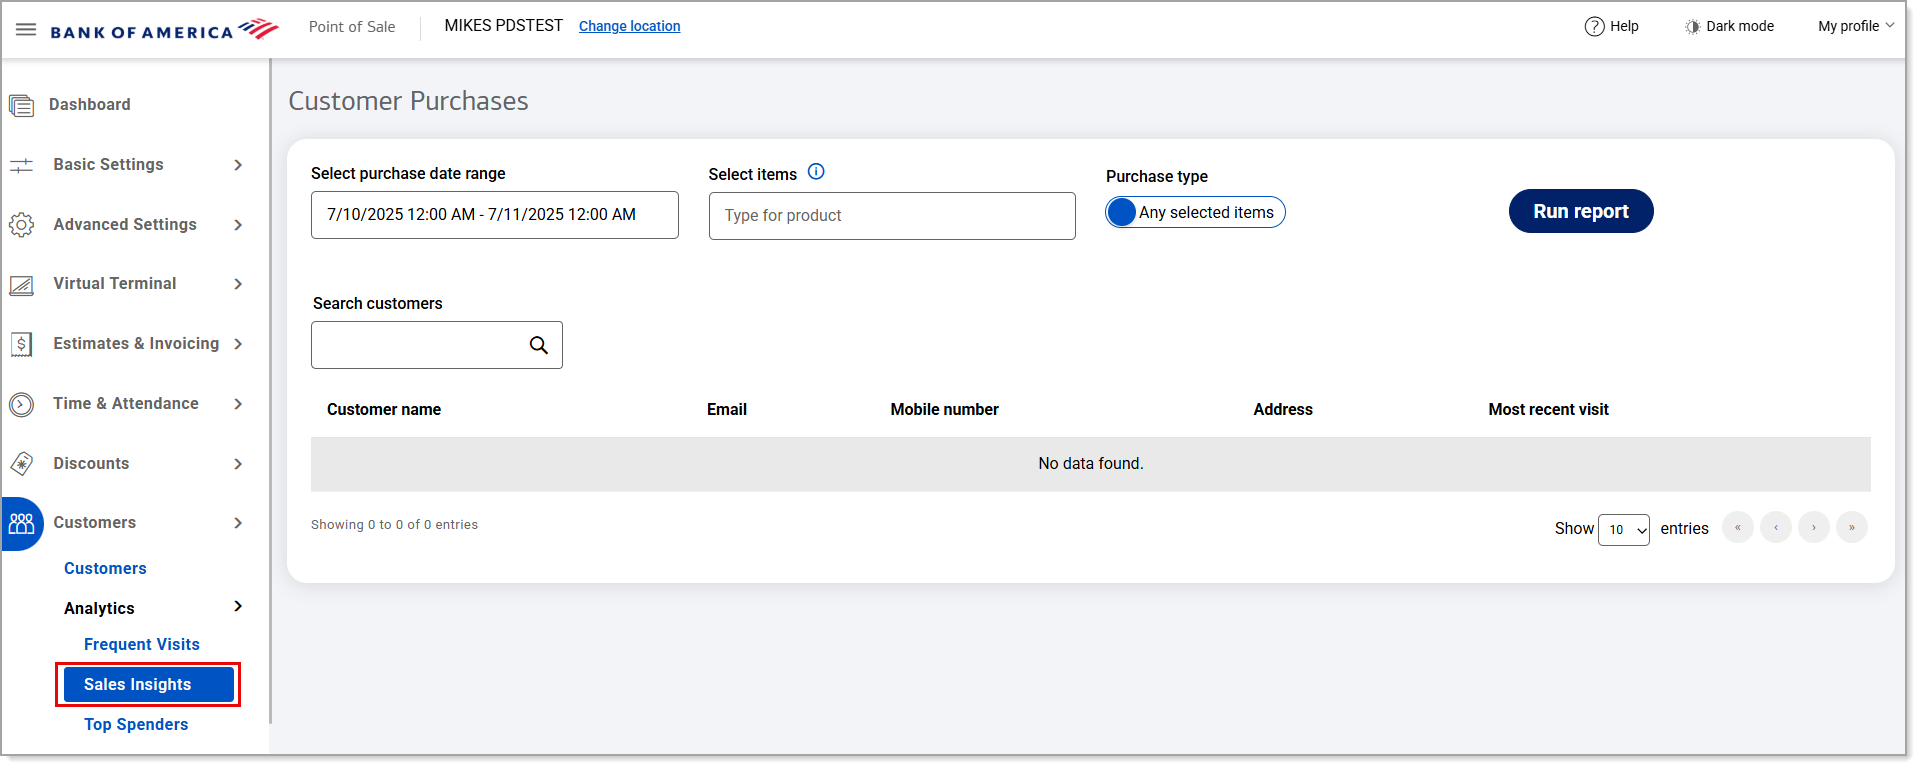
- Select a preset date range or click Custom Range to define your own. Click Apply.
- In the Select items field, begin typing the product name and select it from the populated list. Add multiple products, as needed.
- Refine the report by selecting a Purchase type:
- All selected items: Customers who purchased all of the items selected
- Any selected items: Customers who purchased any of the items selected
- Click Run report.
Top Spenders
The Top Spenders report displays customers who have spent the most during a selected time period, helping you identify high‑value customers.
- In the Point of Sale Solution Back Office, select Customers > Analytics > Top Spenders.
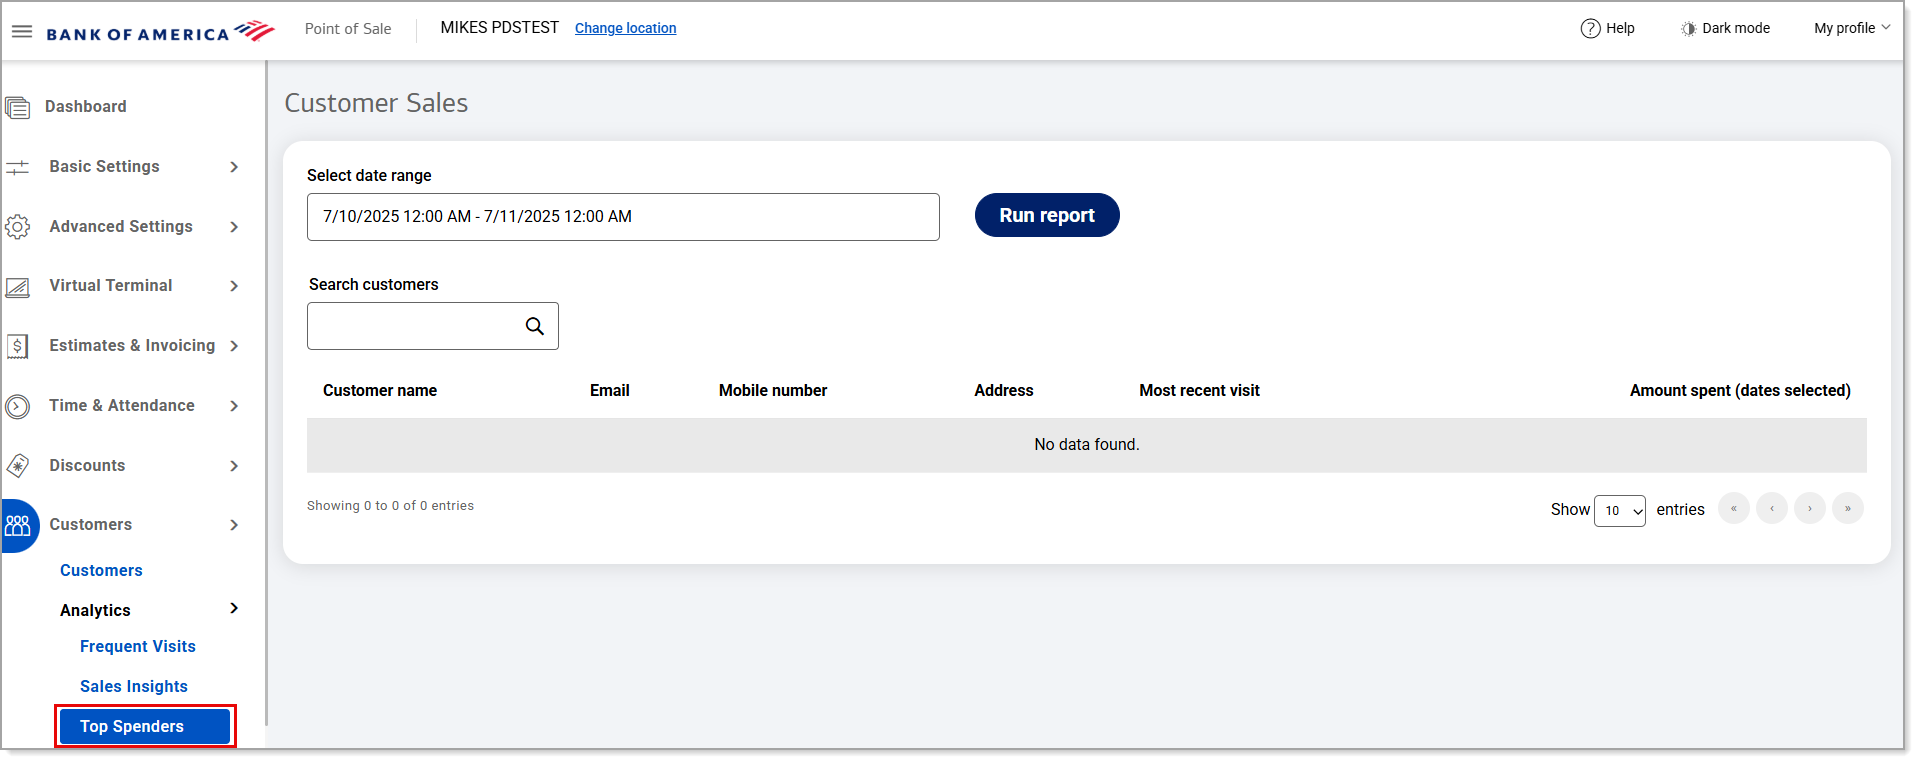
- Select a preset date range or click Custom Range to choose a custom one. Click Apply.
- Click Run report.