Back Office Item Sales Report
Description
How to run an Item Sales report in the Back Office
What's in this article?
Solution: Essentials Light | Essentials | Restaurant
The Item Sales report pulls all of your items with sales activity in the selected date range. You can use this report to find out how well specific items are selling over a specific time period. By selecting a single category, you can see how well the items in that category are selling over a specified time period as well.
To run the Item Sales report
- In the Back Office, select Results tab.
- Select Reports subtab.
- In the left navigation, select Item Sales.
- Select your date range.
- Select Filter by options from the dropdown list to filter by All Categories (default) or a particular category.
- Click the Show Variations button to display any item variations, including their quantity sold.
- Click the refresh icon.
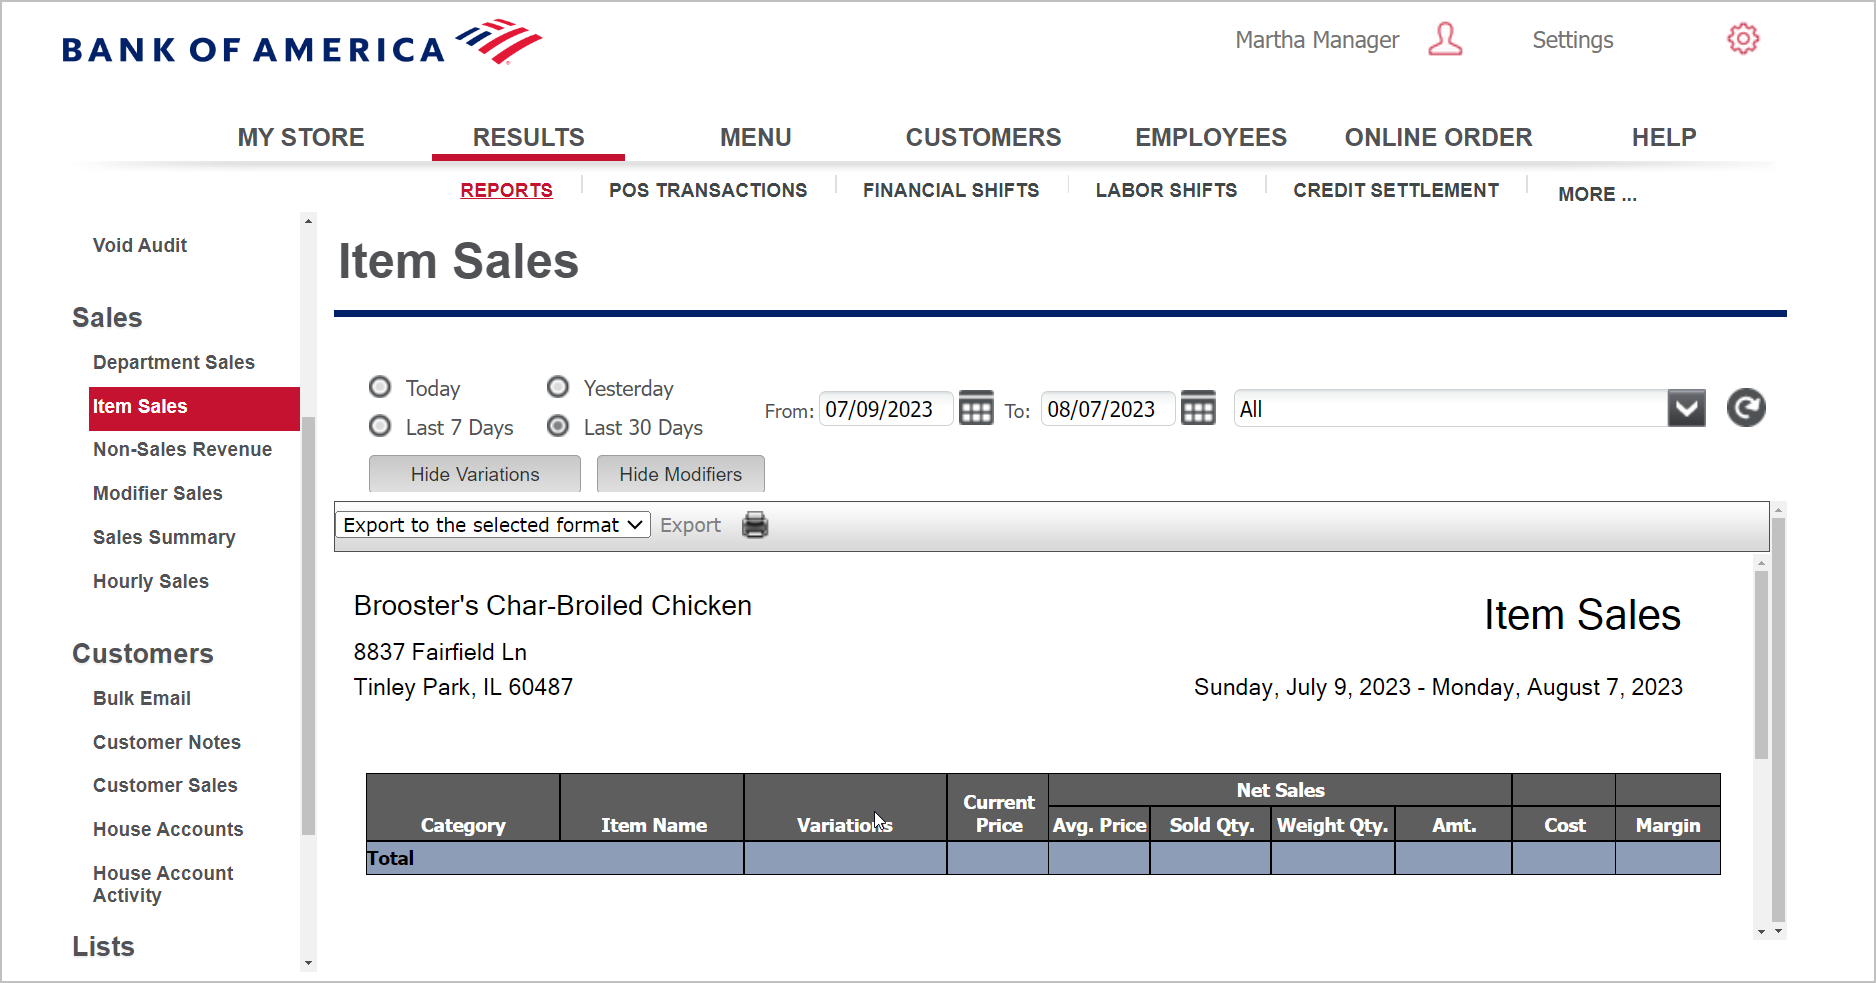
The report shows:
- The Net Sales Amount per item, which is calculated by multiplying the Avg. Price and the Sold Quantity. Keep in mind the Avg. Price may not always equal the Current Price because of “prompt for price” items and price overrides.
- You can also view the Margin for each item, as well as subtotals by category, as well as grand totals.
| Field | Description |
|---|---|
| Category | The name of the category |
| Item Name | The name of the item/kit |
| Variations | The variations for the item |
| Current Price | Current price of an item |
| Net Sales: Avg. Price | Average price of an item |
| Net Sales: Sold Qty | Item sold quantity |
| Net Sales: Weight Qty | Item weight quantity |
| Net Sales: Amt. | Item total sale amount |
| Net Sales: Cost | Item cost price |
| Net Sales: Margin | Total margin sale amount |