Point of Sale Solution Back Office Tour
Description
What's in this article?
From the top banner, you can switch store locations, adjust display settings, access support resources, and manage your profile. The dashboard presents a clear, real-time snapshot of store performance, helping you make efficient and informed business decisions.
Banner features
The top banner of the Point of Sale Back Office provides quick access to key settings and tools, including location selection, support resources, display preferences, and account management.
| Feature | Description |
|---|---|
| Change location | Click the current location to switch between store locations. NOTE: Your location code is displayed here. |
| Help | Opens the Merchant Help Center, where you can find troubleshooting and instructional articles. |
| Light/Dark mode | Toggle between Light and Dark display modes. |
| Browse with Specialist | If requested by a support agent, click this option and provide the code to the agent to enable guided support. |
| My profile | Open a dropdown menu to change your password, provide feedback, switch store, or sign out of the Point of Sale Back Office. |
Dashboard
The Dashboard is a snapshot overview of up-to-date sales of the day from your selected store location. Data like gross sales, returns, discounts, net sales, and average dollar per guest are calculated and reported. Both the date and location can be adjusted to view the history in different locations.
By default, the Dashboard displays the current date but can also be changed to display others. Click the calendar in the upper right corner of the dashboard to select another date.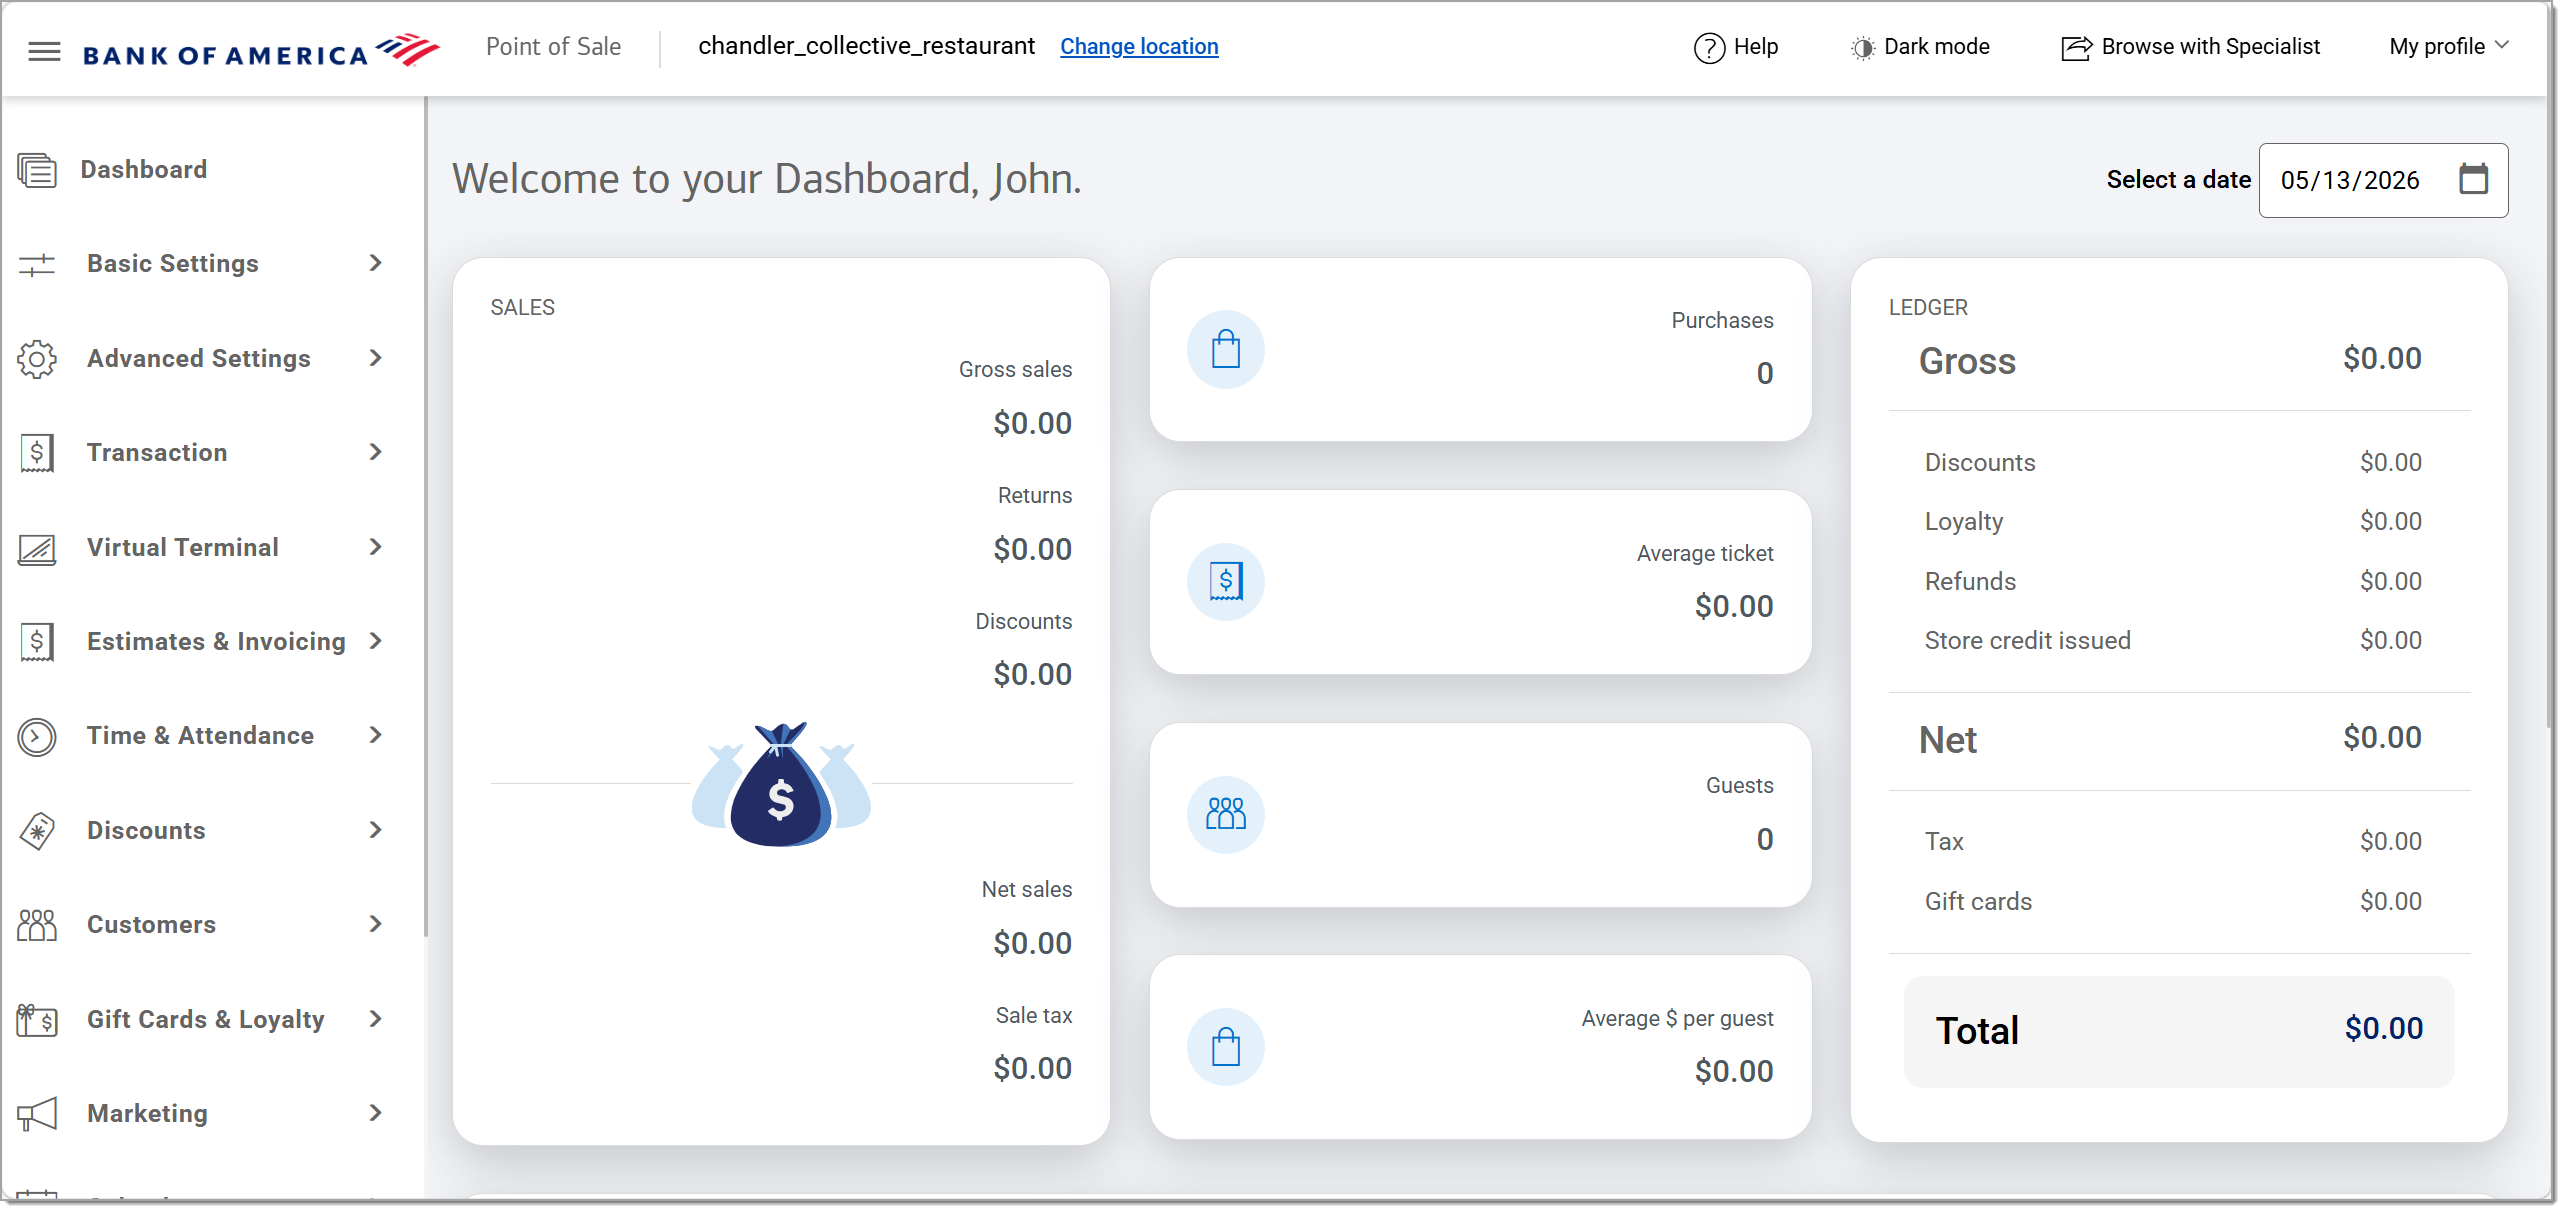
| Features | Description |
|---|---|
| Sales | View the gross and net sales, the amount of returns and discounts, and the total sales tax for the day in real time. |
| Purchases | Total number of orders completed for the day. |
| Average ticket | Total dollar average from tickets. |
| Guests | Number of customers who have made a purchase. |
| Average $ per guest | Average dollar spent per paying customer. |
| Ledger | View a breakdown of you ledger for the day. Gross sales, net sales after discounts, loyalty awards, refunds, and Store credit issued, as well as taxes charged and gift card dollars used, and the total dollars collected, are displayed. |
| Purchases per hour | The graph shows the volume of sales made per hour in the day. This helps determine what the peak hours are and gives a better idea of staffing needs. |