Merchant Services Dashboard
Description
What's in this article?
The Merchant Services Dashboard provides a quick view of your sales activity, authorization, processed sales, activity by card network, and trends. The Dashboard appears when you select either the relationship- or location-level account from your Accounts page in online banking. The Dashboard view can be filtered by date (today, last 7 days, last 30 days) using the dropdown list in the top right corner.
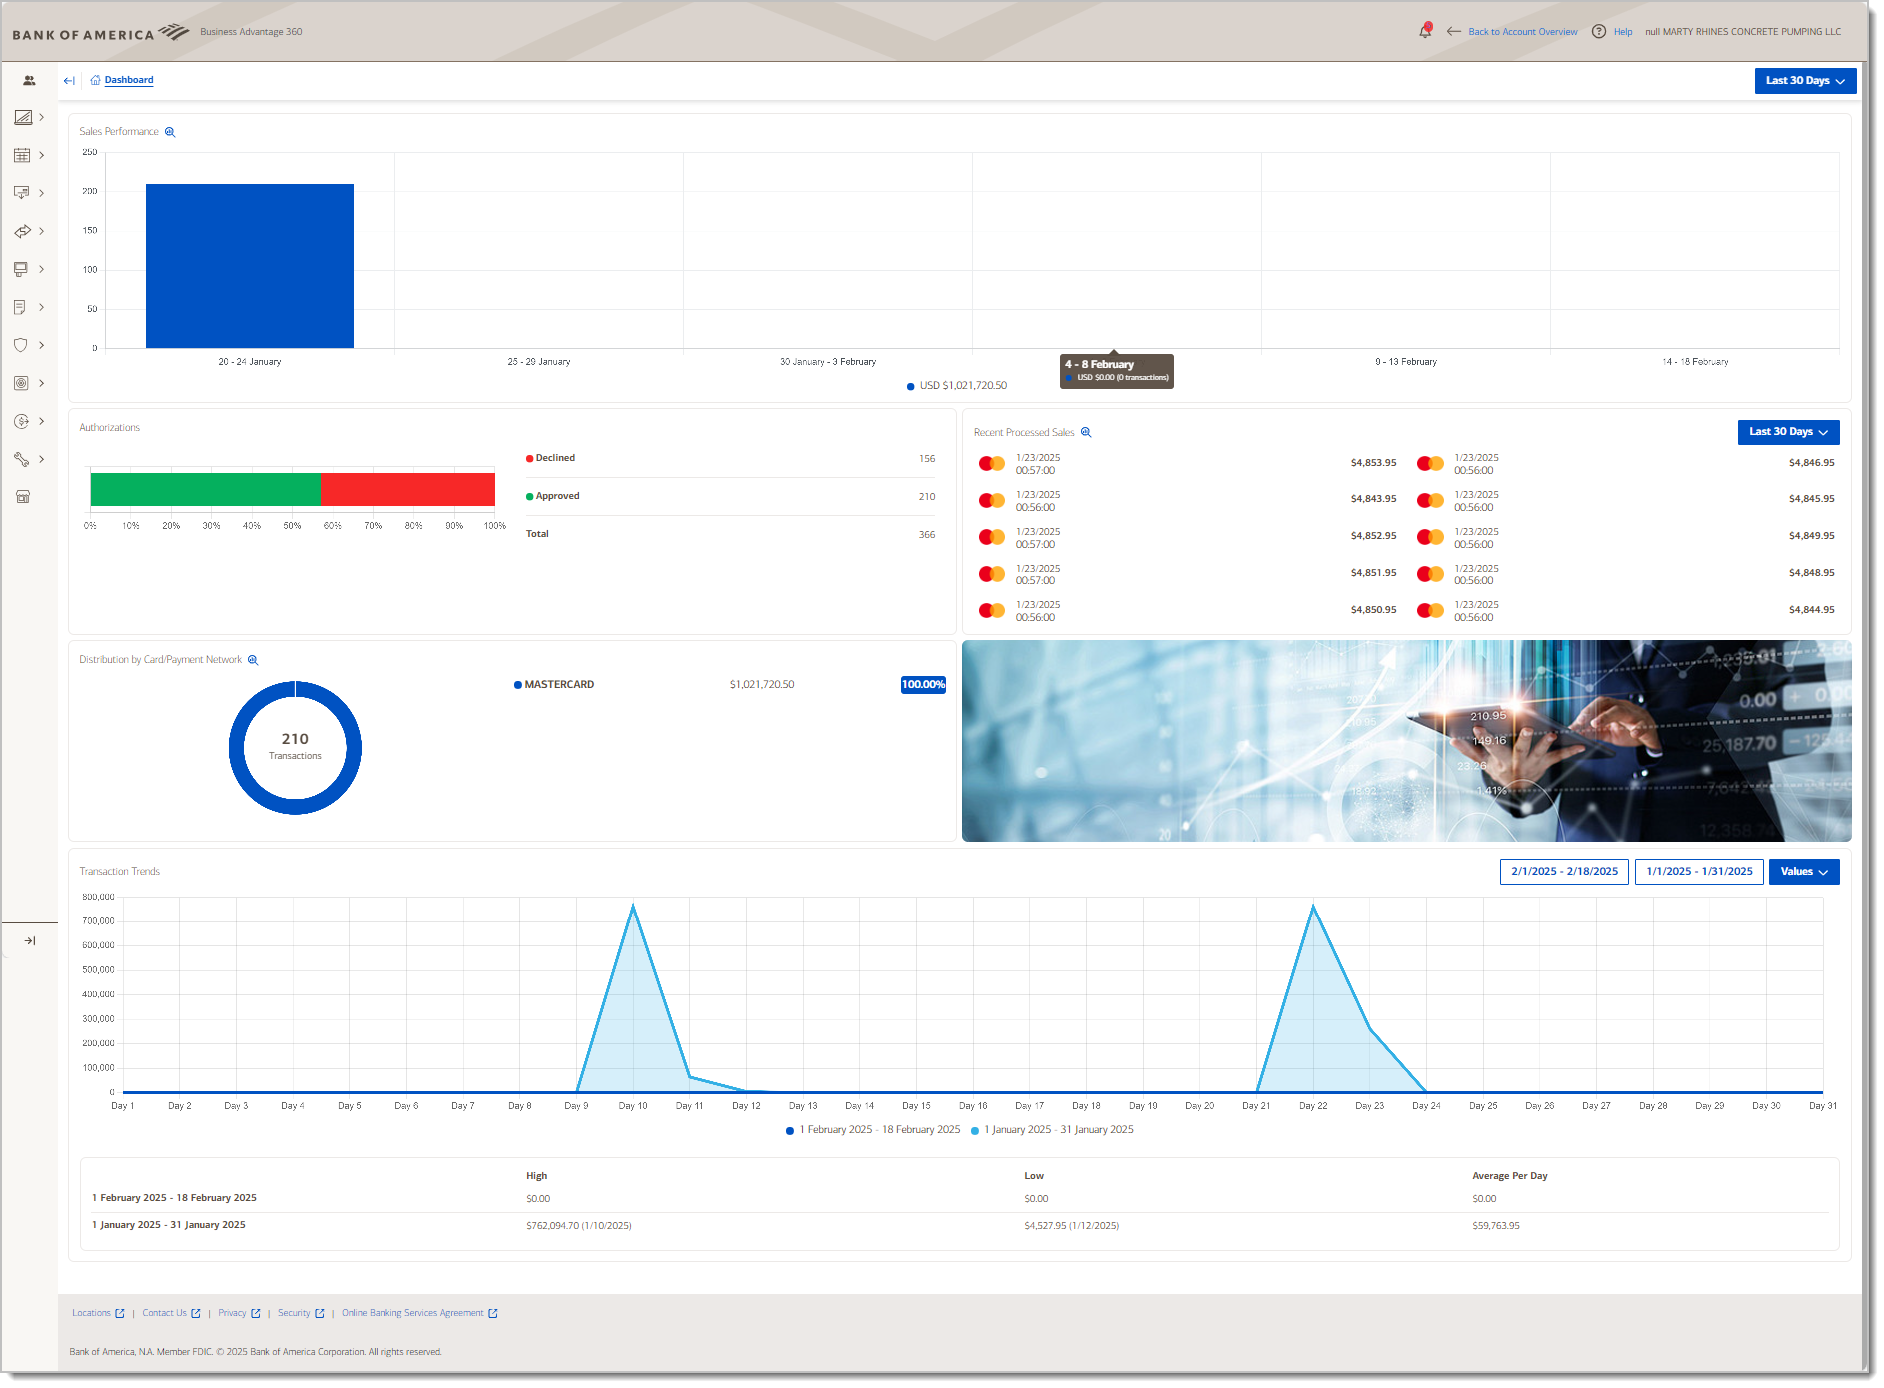
Sales Performance
The Sales Performance view shows the number of transactions for a given day or group of days. If you mouse over the column, the total sales for that day/day group appear. Clicking full analysis will open the Activity view of your Sales reports.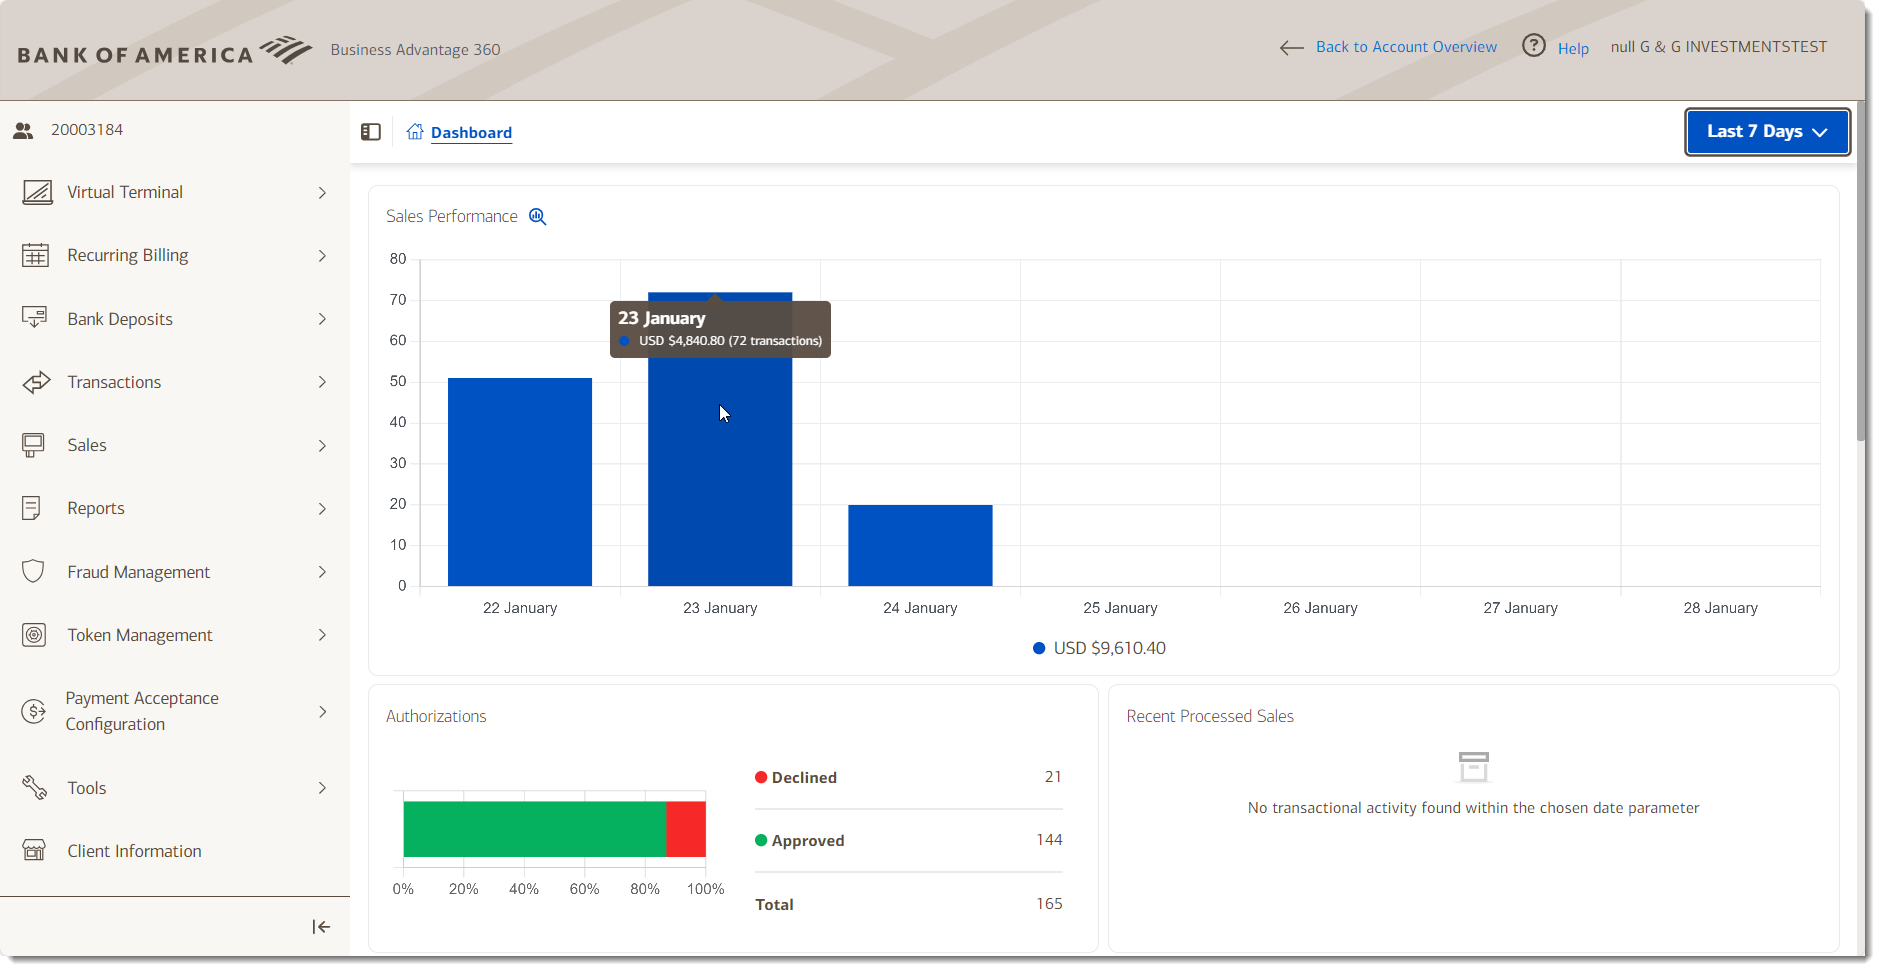
Authorizations
Shows the transaction authorization decline and approved rate and the total number of authorizations for the time period selected.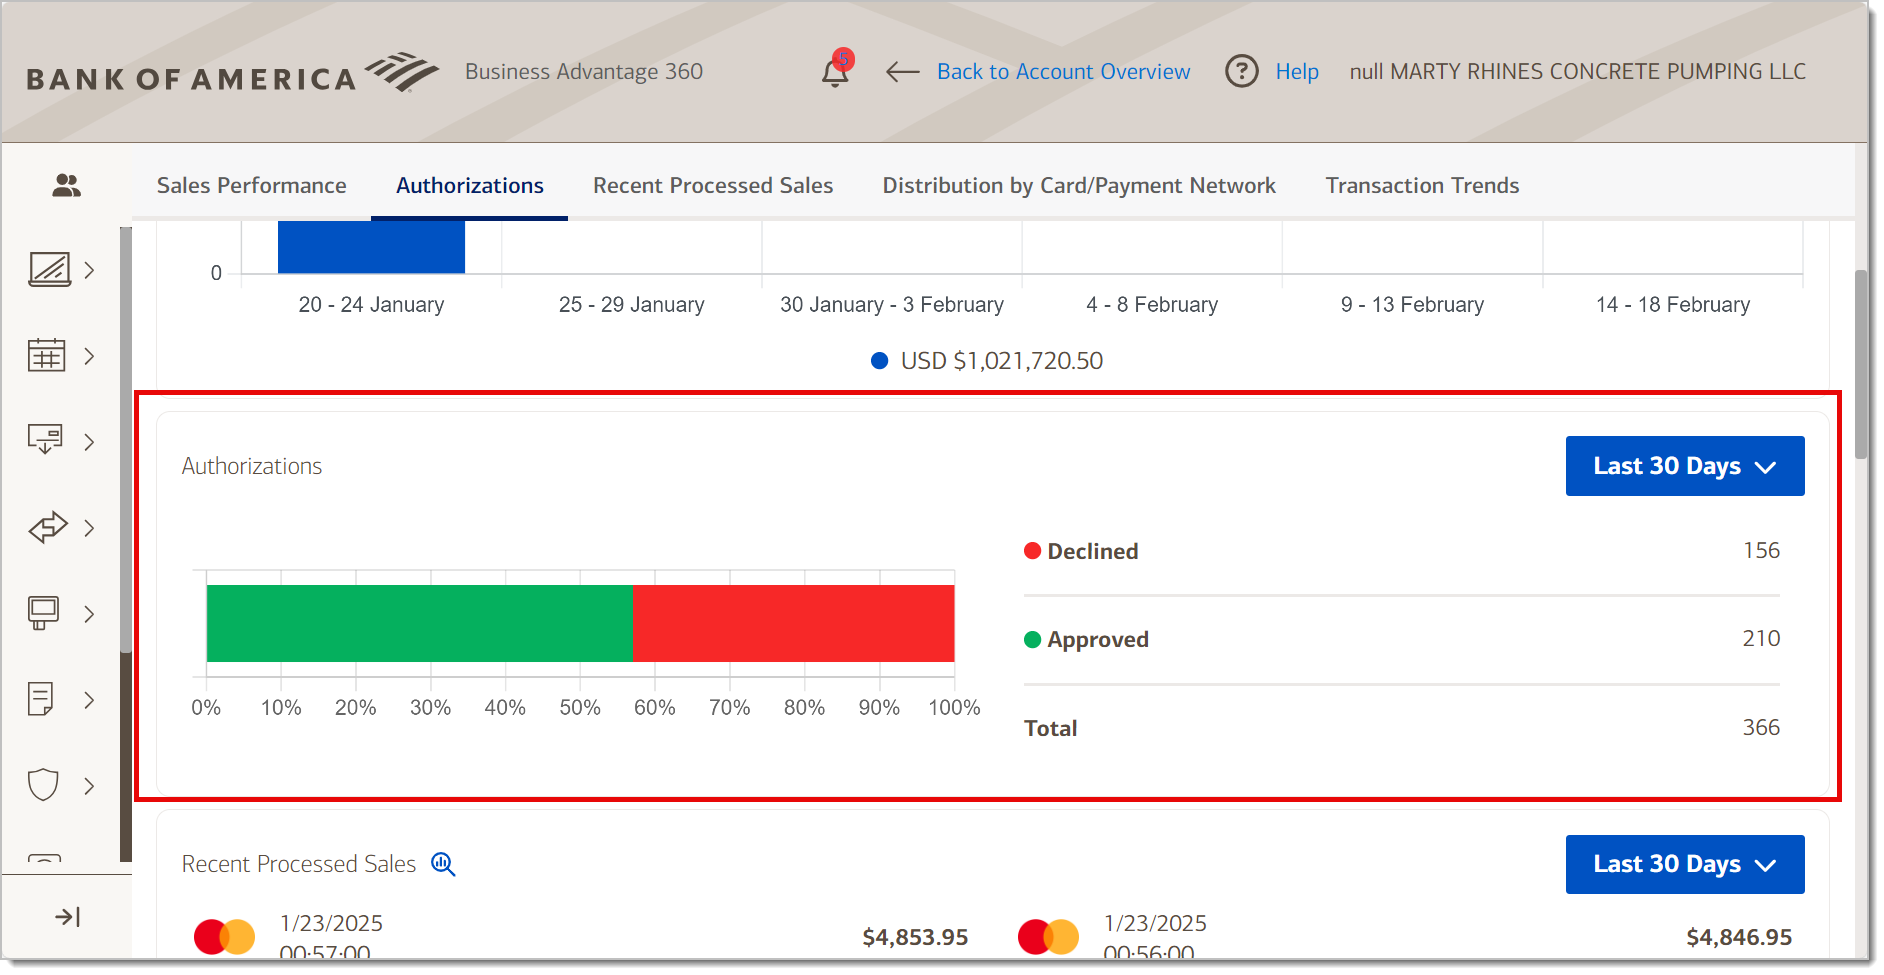
Recent Processed Sales
Displays the last ten transactions processed, showing the card network, date, time, and amount.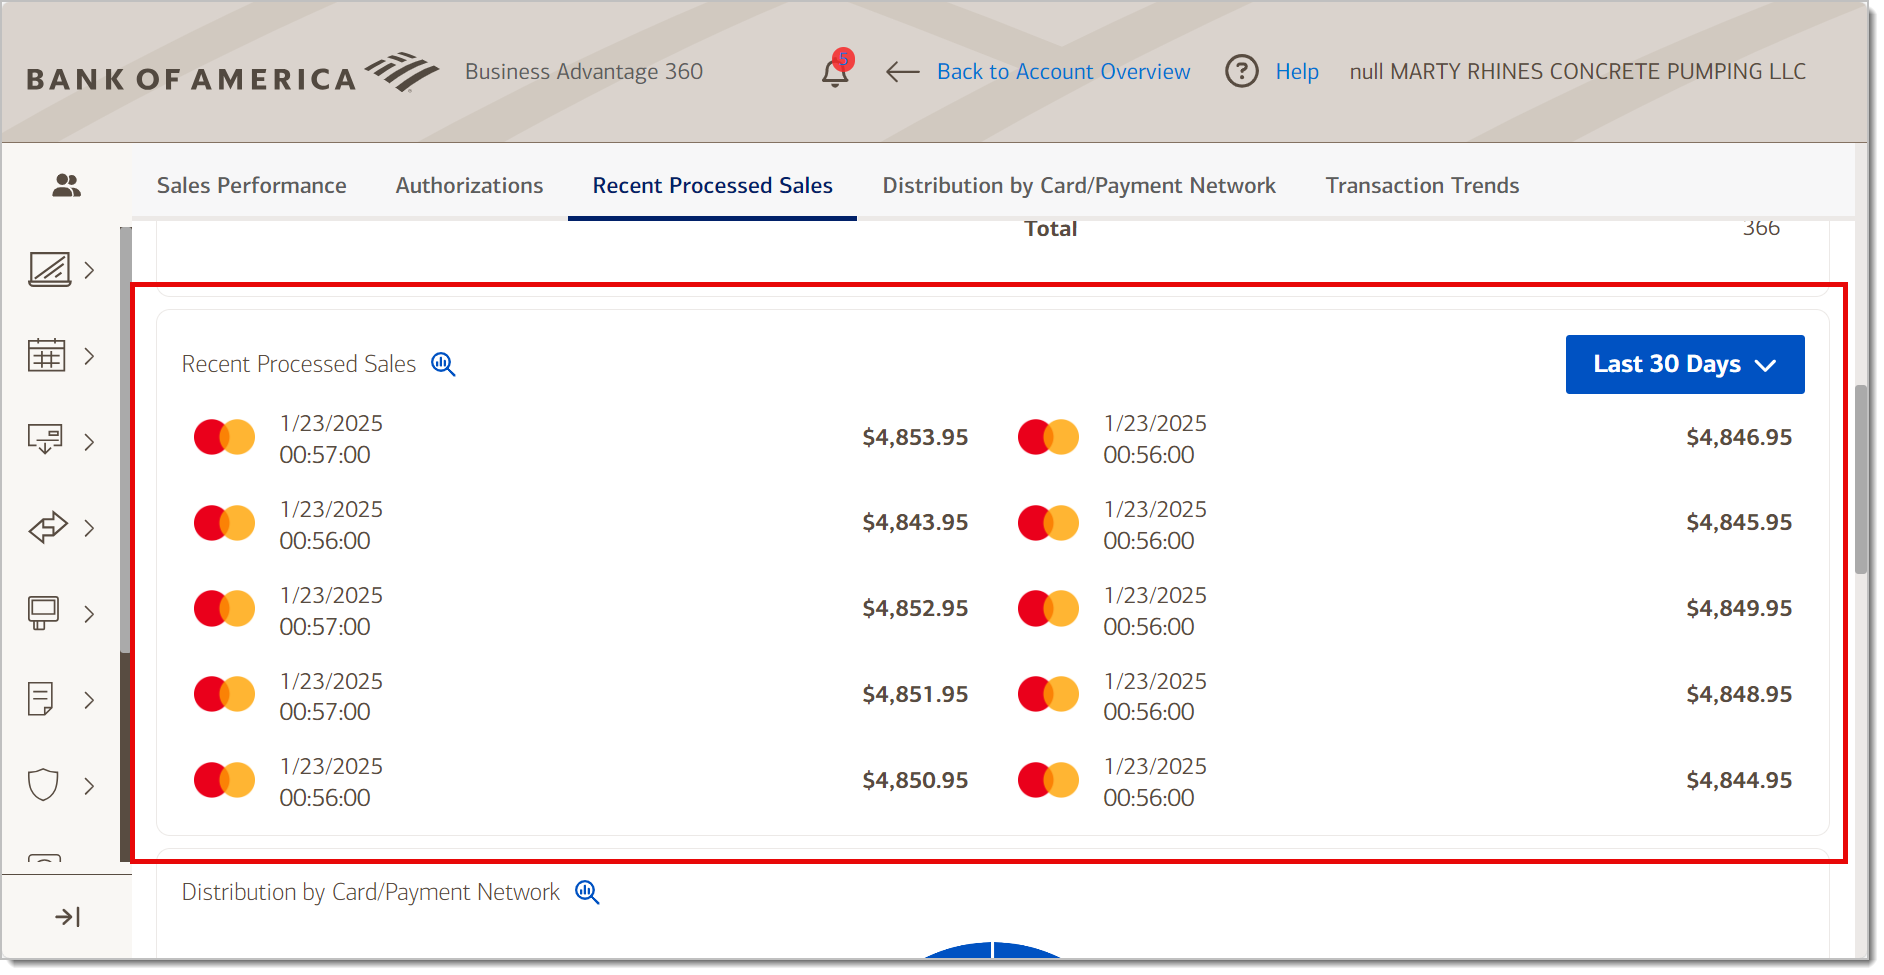
Distribution by Card/Payment Network
Displays the number of transaction per card network, showing the total value as well as the percentage per card network of the total transactions for that client. 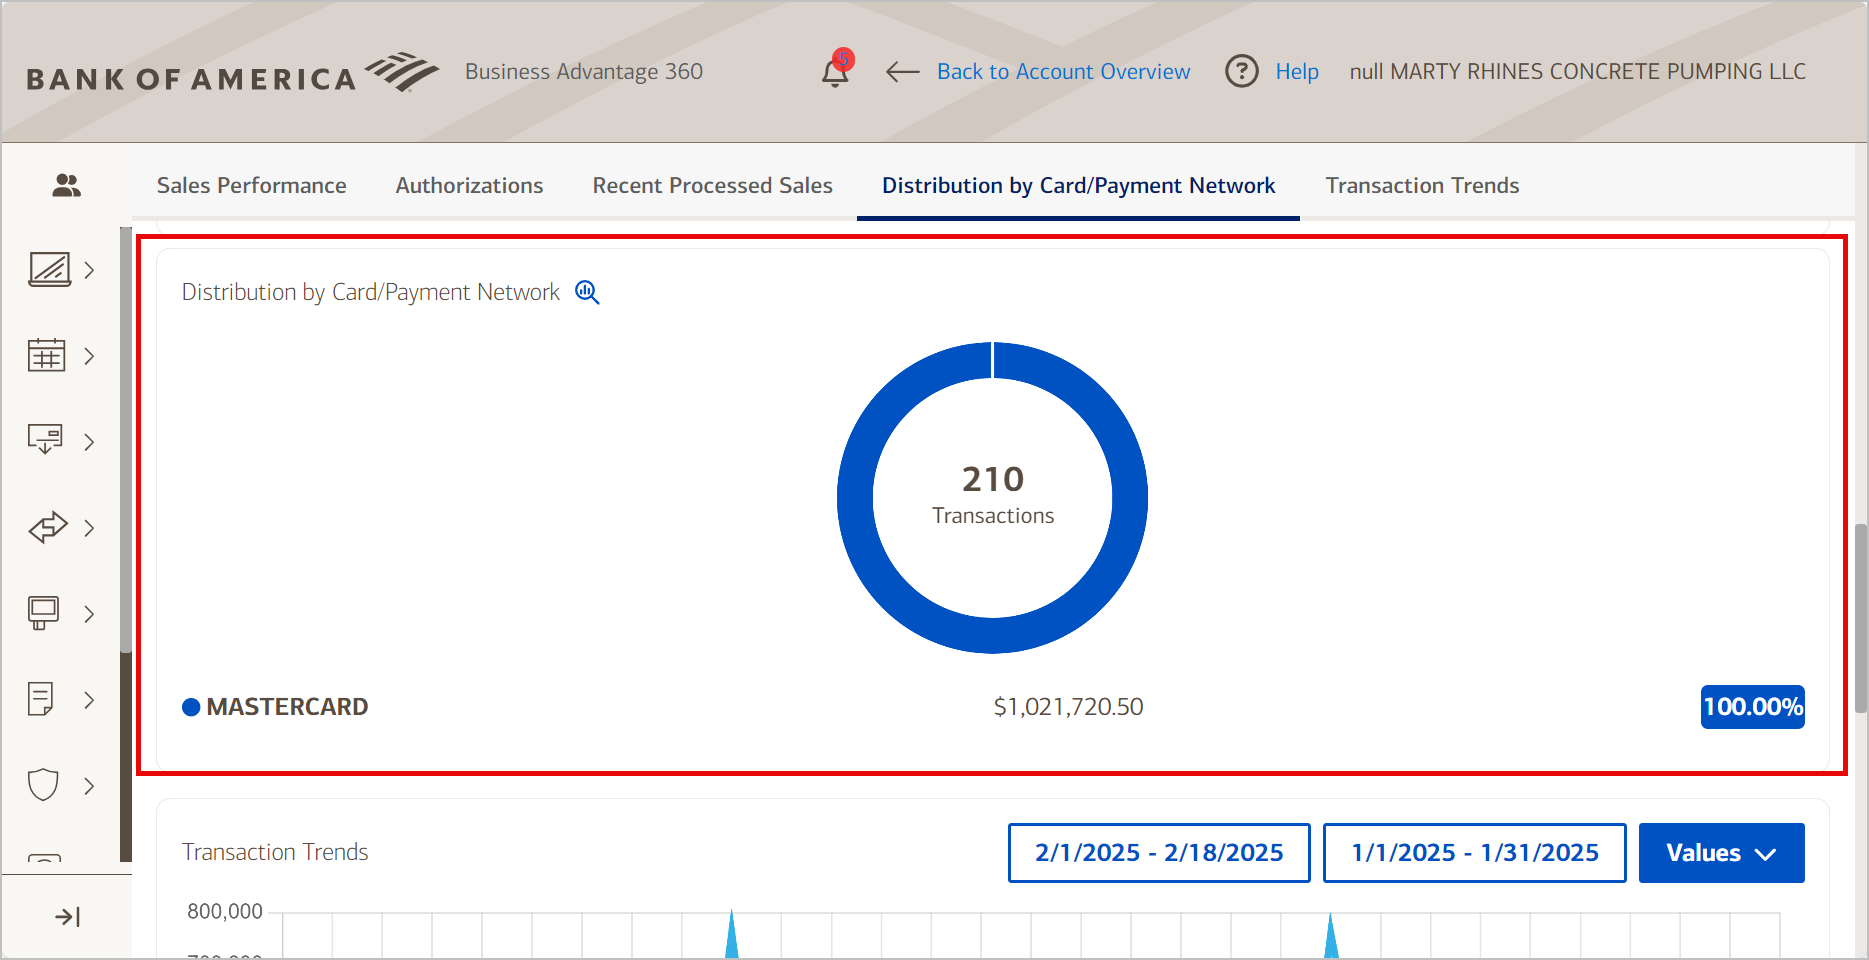
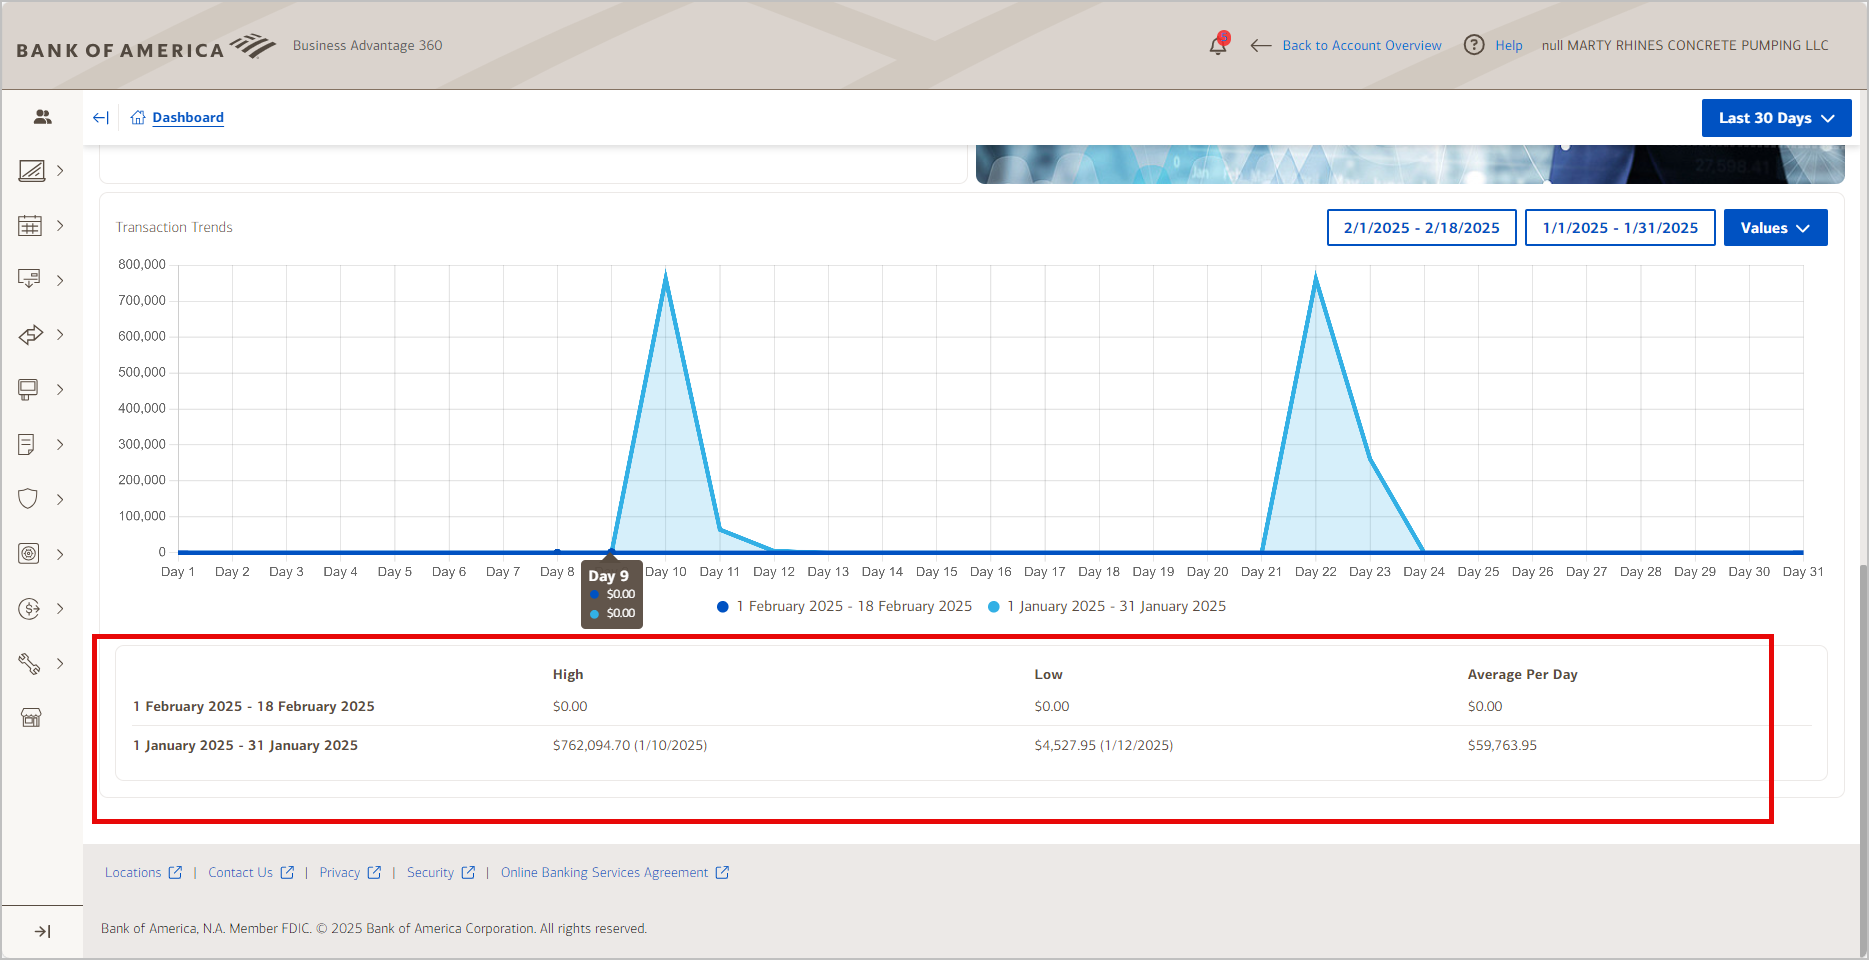
Transaction Trends
Shows the transaction value or volume by date for the selected time period. Select Values or Volume from the Values dropdown.
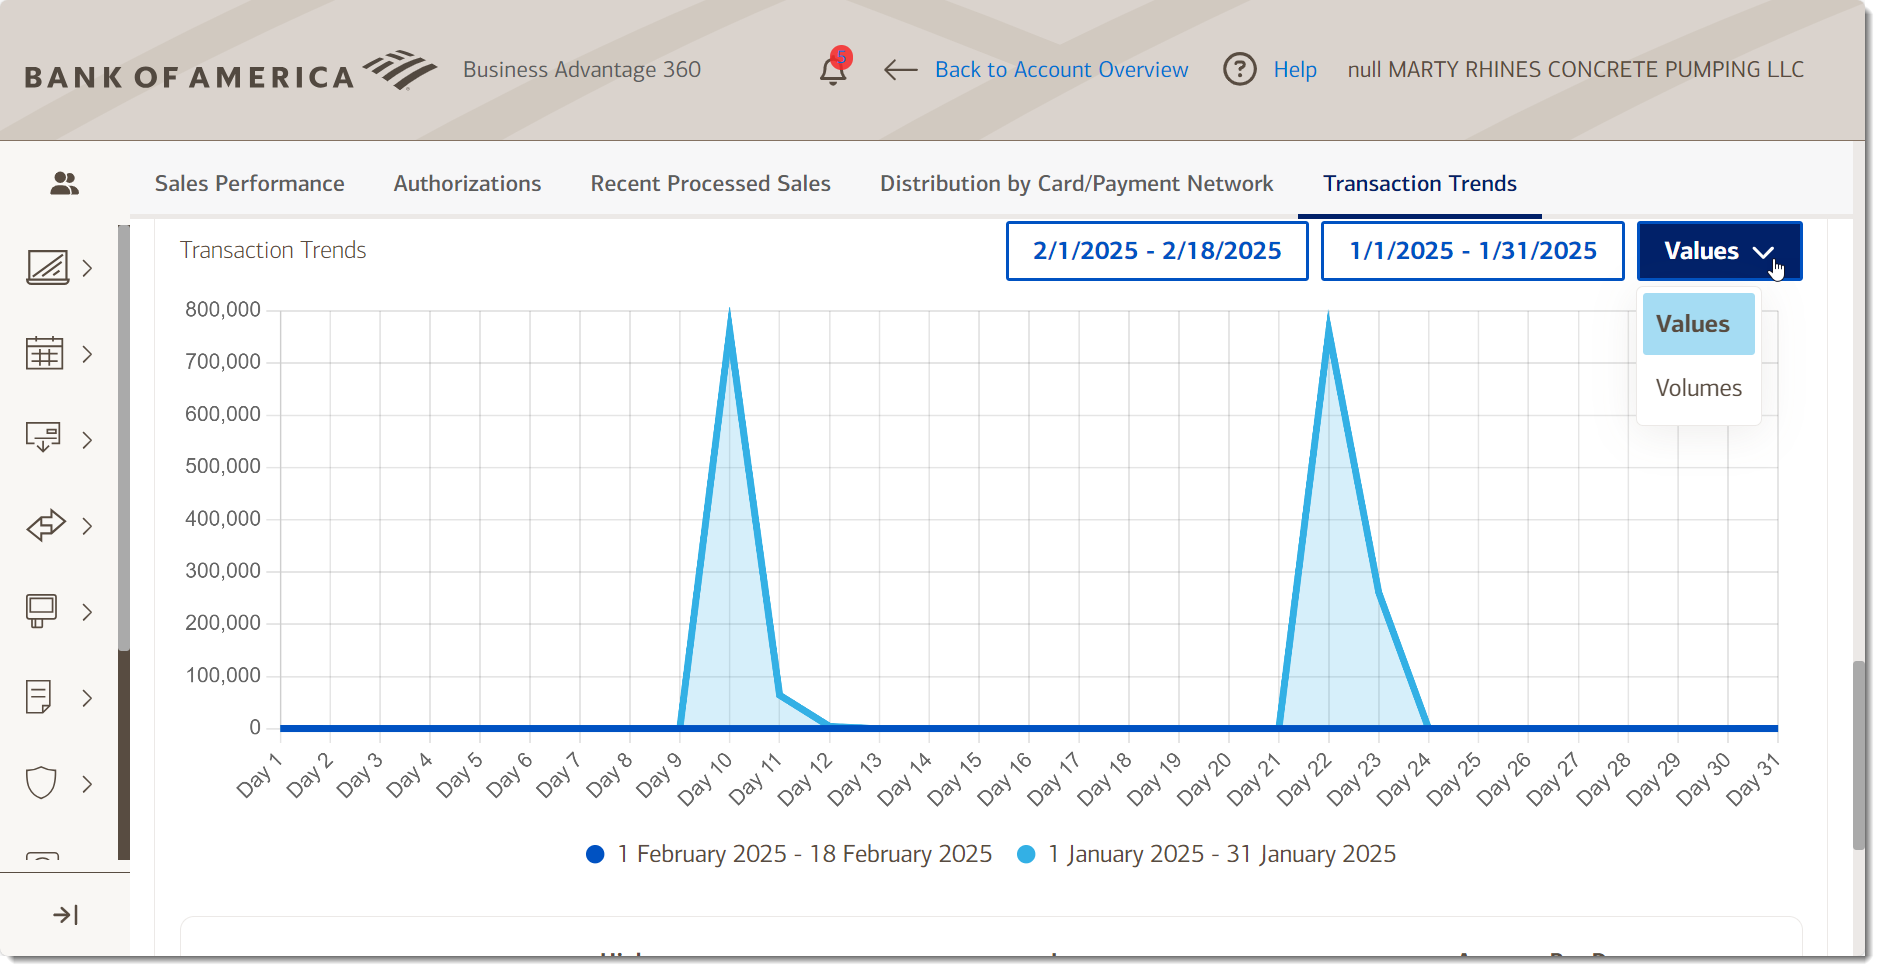 You can also view the highest and lowest transactions by value or by average value per day.