Point of Sale Solution Back Office Cost of Goods Report
Description
How to download a Cost of Goods report
What's in this article?
Software Plan: Starter | Growth | Pro
The Cost of Goods report provides financial information related to your items including cost, discounts, gross margin and profit, and your net sales. Using this report helps you to determine net sales for each item. You can create a report using preset or custom date ranges, and reports can be downloaded and saved in Excel format.
To run the Cost of Goods report
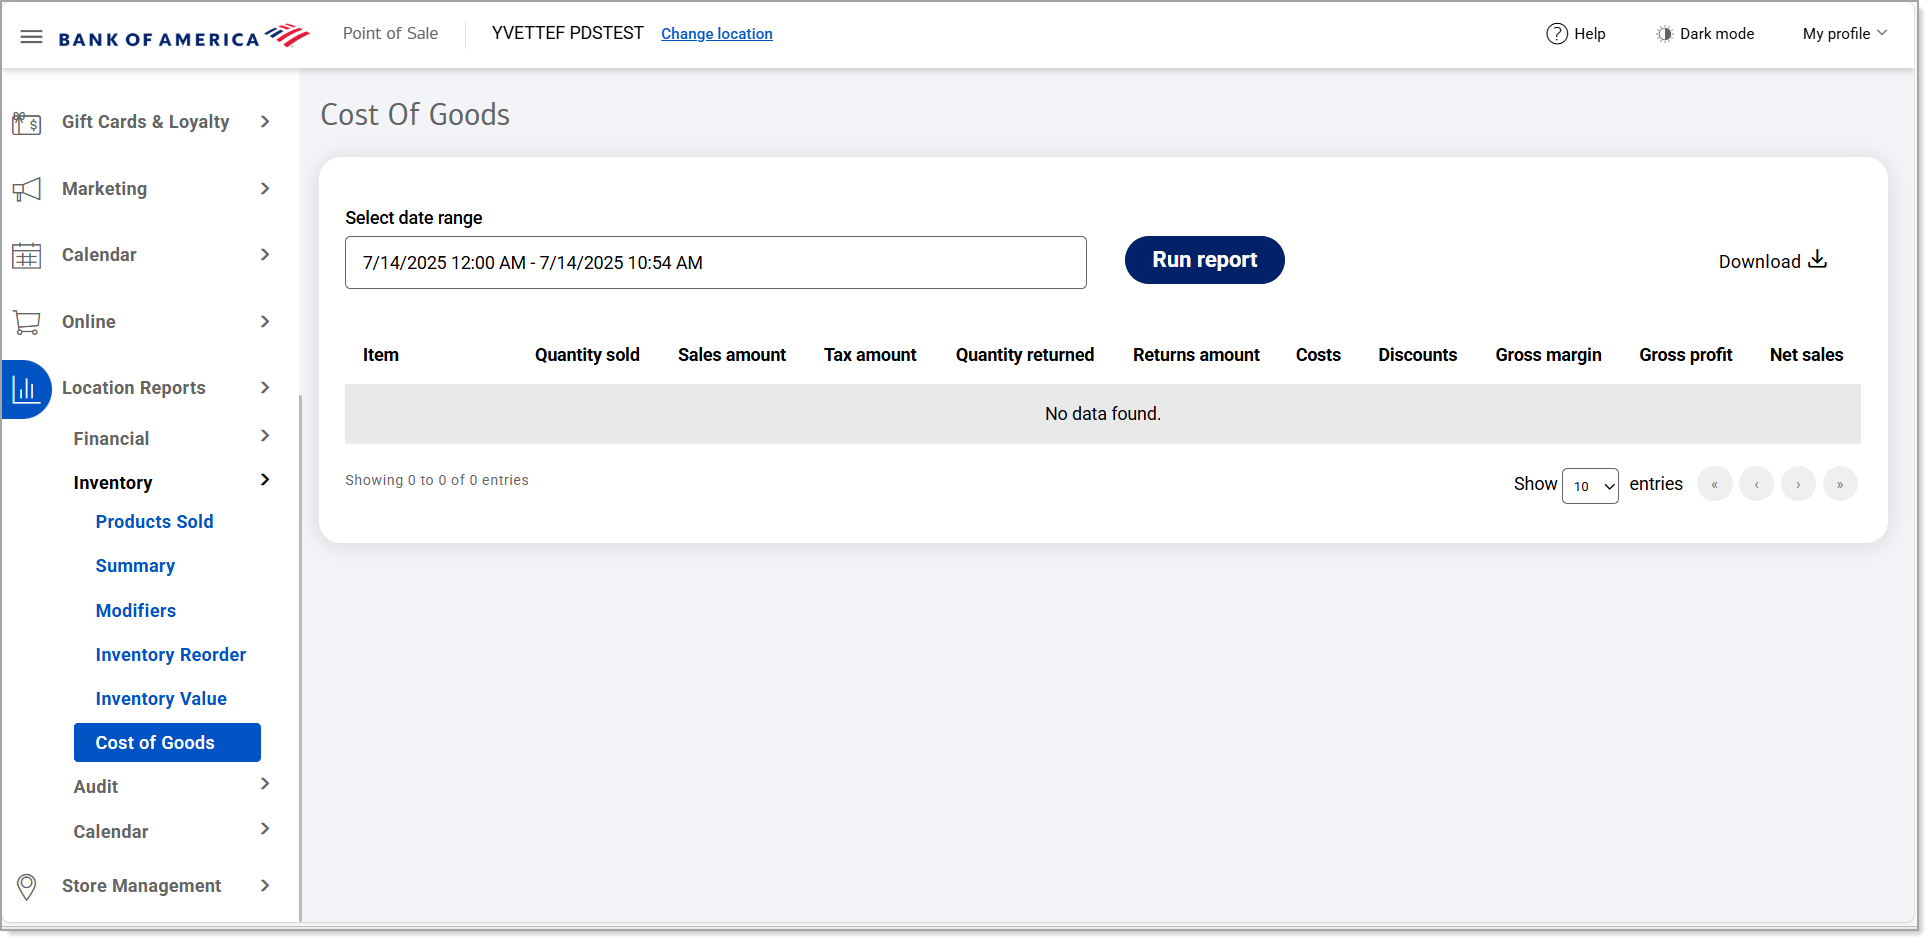
- In the Point of Sale Solution Back Office, select Location Reports > Inventory > Cost of Goods.
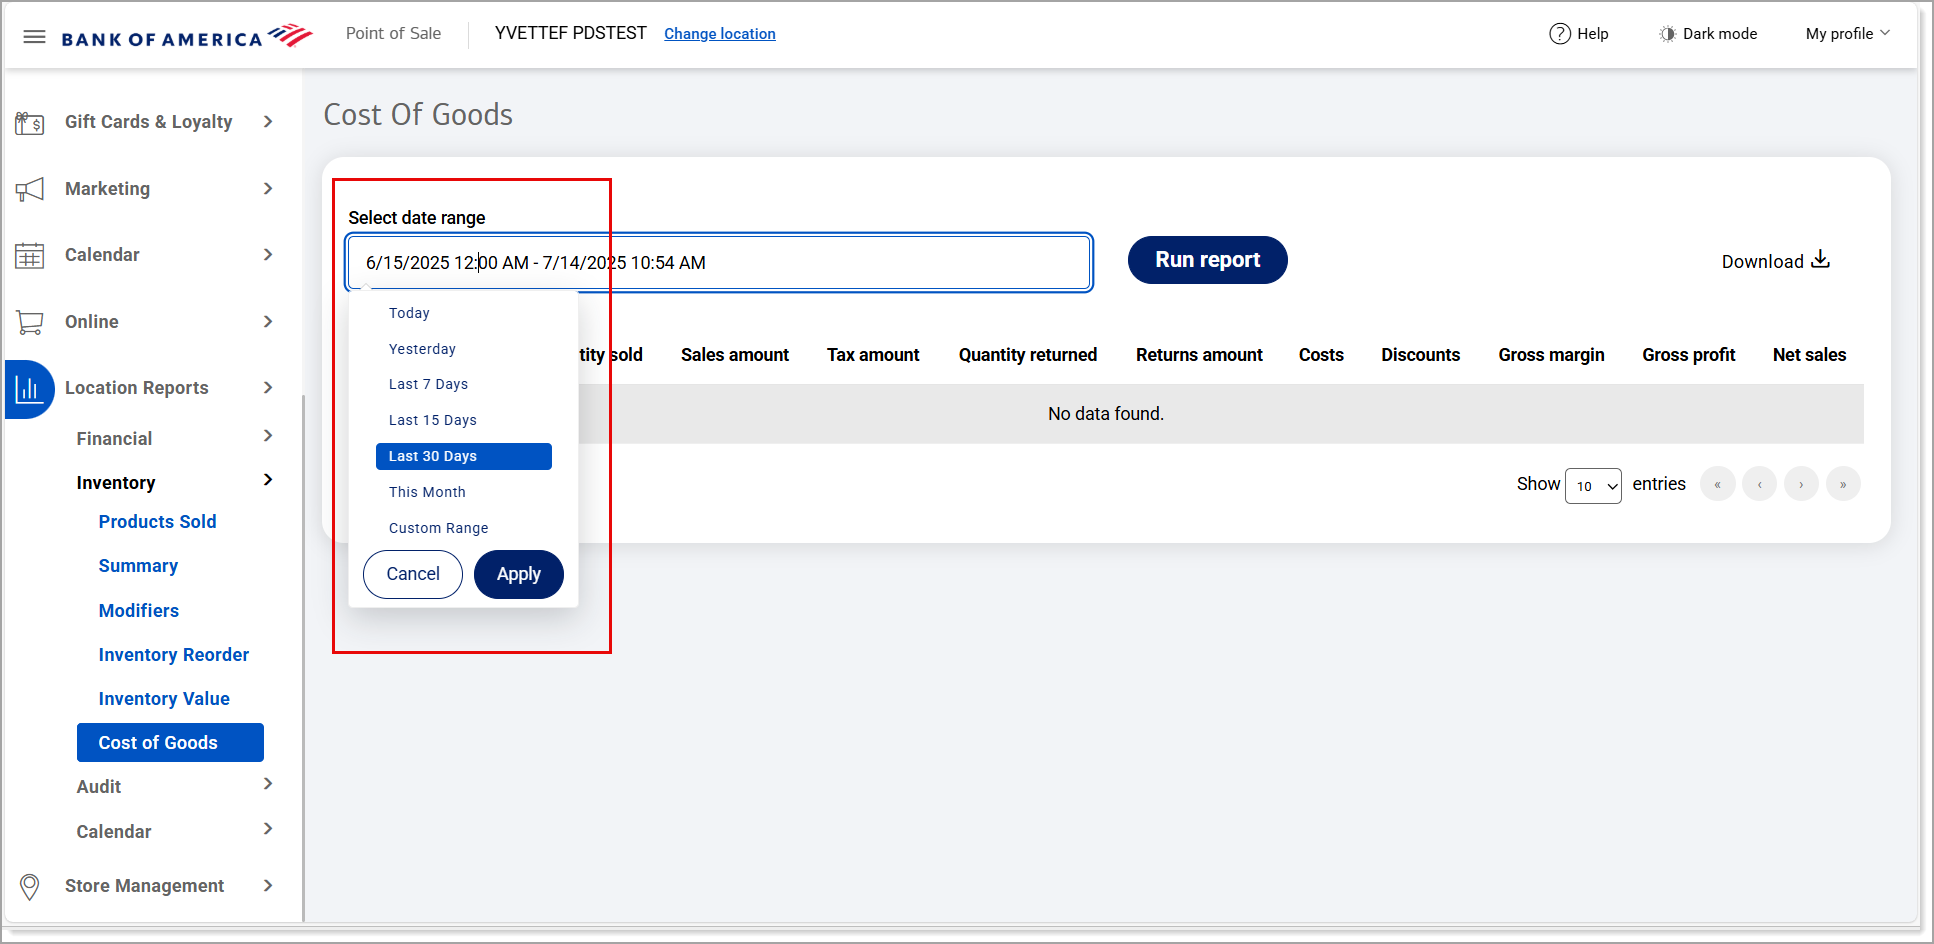
- Select a preset range from the dropdown list or select Custom Range to set specific dates and times. Click Apply.
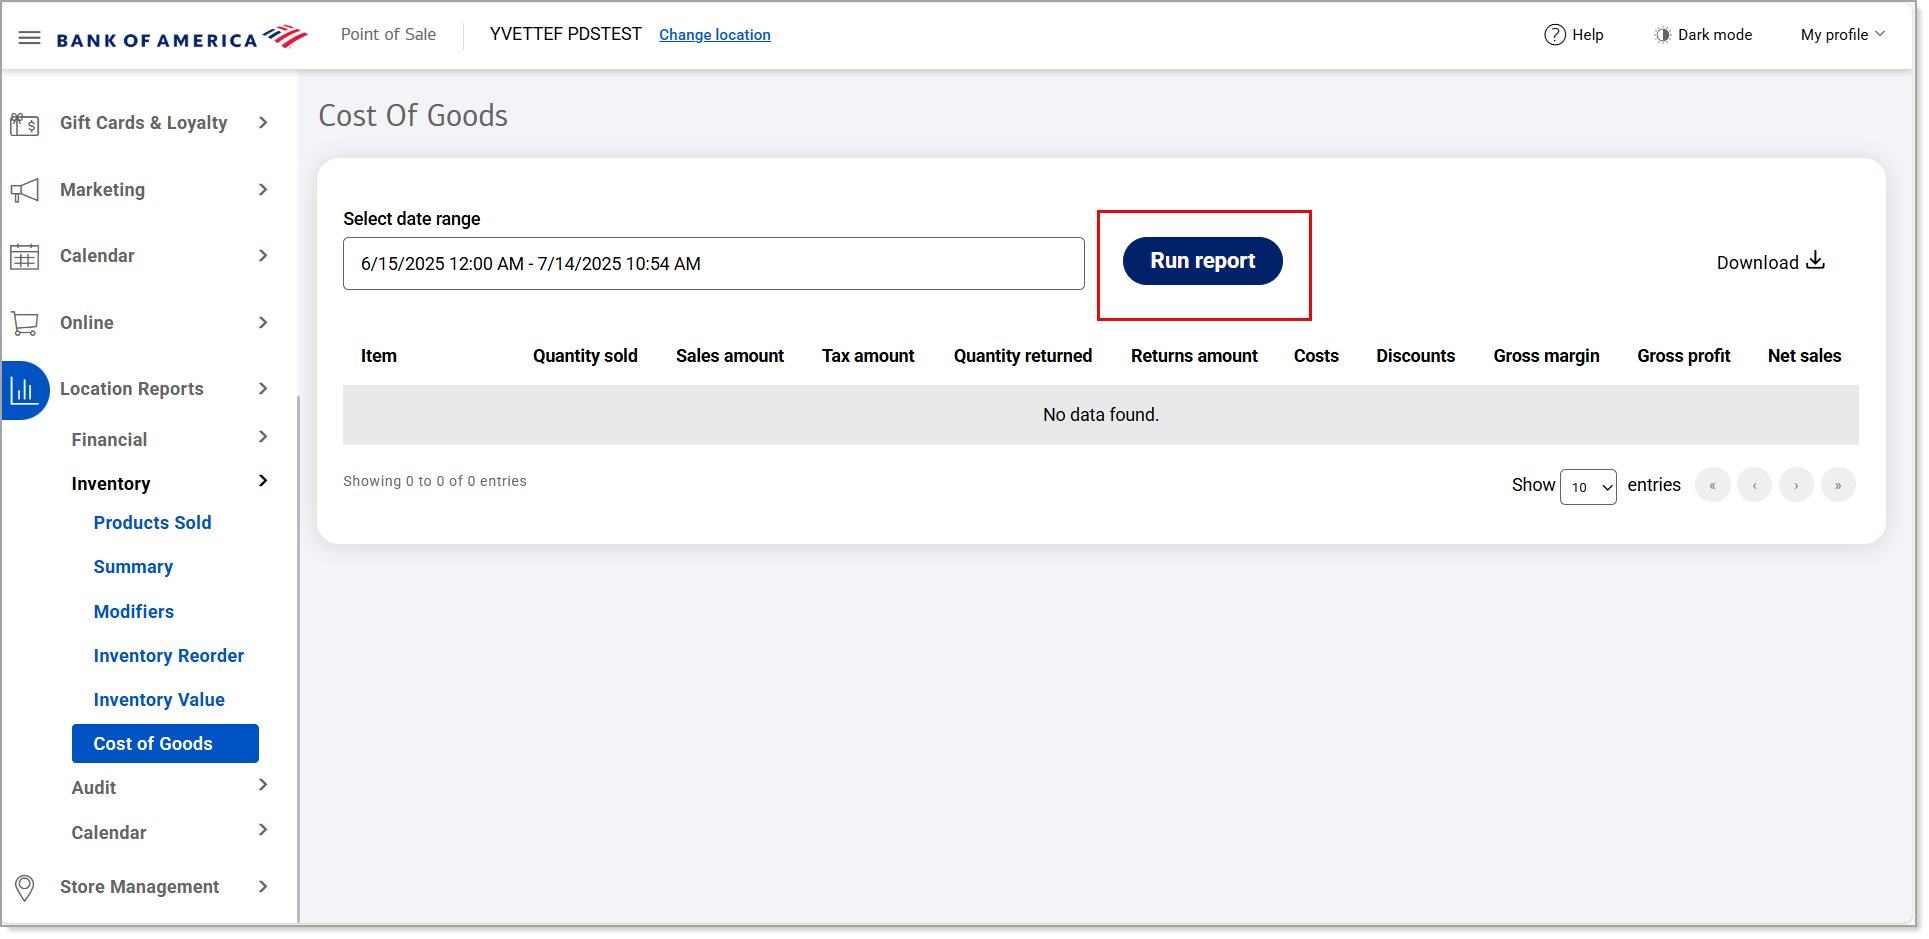
- Click Run report.
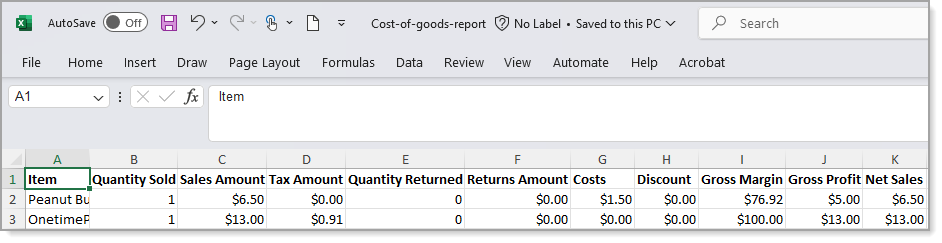
- Click Download to download the report in Excel format.
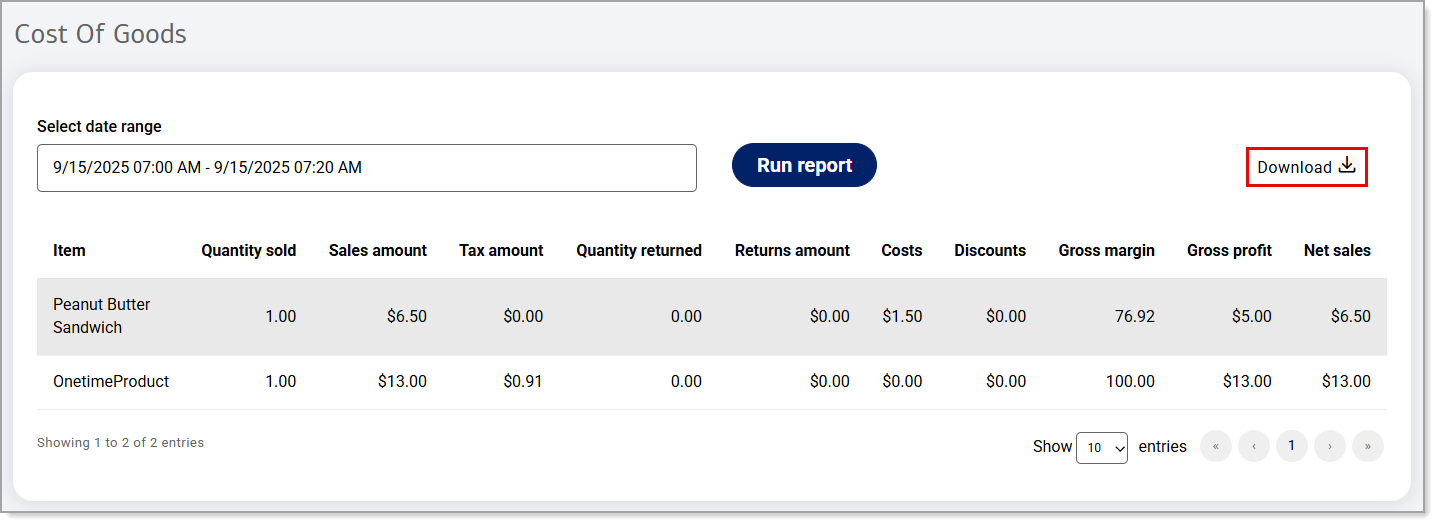
The data will display for the time period you have specified.
The report will include the following:
| Field | Description |
|---|---|
| Item | Item name. |
| Quantity sold | The number of items sold. |
| Sales amount | The dollar amount for which the item is sold. |
| Tax amount | The tax amount on the item. |
| Quantity returned | The number of items that have been returned. |
| Returns amount | The total dollar amount of returns related to the item. |
| Costs | Expense of the item. |
| Discount | The amount discounted off the sales amount of the item. |
| Gross margin | The percentage of money kept from sales after covering the direct costs of the item. |
| Gross profit | The total profit for the item after subtracting the cost of goods sold (COGS). |
| Net sales | The the total revenue generated from sales of the item after deducting returns, costs, and discounts. |